lazy high chart
Updated at: February 23, 2017
@lazy_high_chart_github which is the implementation of js library high chart in rails
sample, what does it look like?
axes
controller
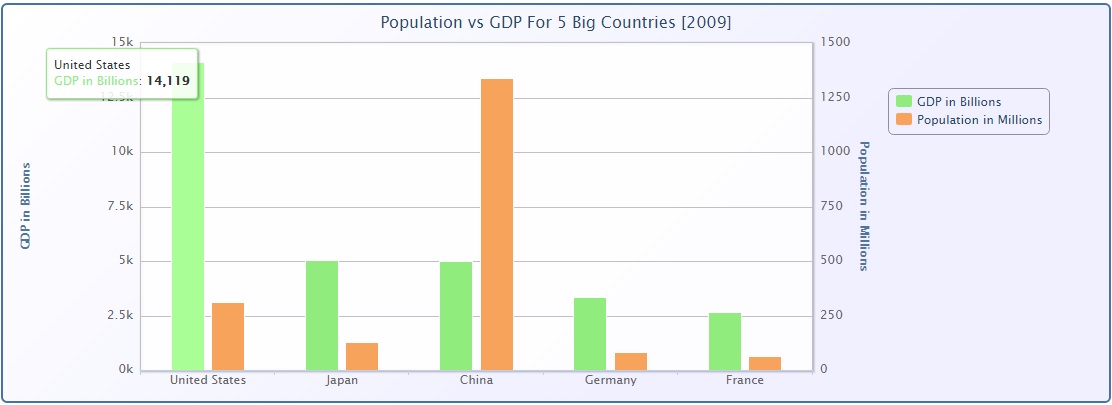
@chart = LazyHighCharts::HighChart.new('graph') do |f|
  f.title(text: "Population vs GDP For 5 Big Countries [2009]")
  f.xAxis(categories: ["United States", "Japan", "China", "Germany", "France"])
  f.series(name: "GDP in Billions", yAxis: 0, data: [14119, 5068, 4985, 3339, 2656])
  f.series(name: "Population in Millions", yAxis: 1, data: [310, 127, 1340, 81, 65])

  f.yAxis [
    {title: {text: "GDP in Billions", margin: 70} },
    {title: {text: "Population in Millions"}, opposite: true},
  ]

  f.legend(align: 'right', verticalAlign: 'top', y: 75, x: -50, layout: 'vertical')
  f.chart({defaultSeriesType: "column"})
end

@chart_globals = LazyHighCharts::HighChartGlobals.new do |f|
  f.global(useUTC: false)
  f.chart(
    backgroundColor: {
      linearGradient: [0, 0, 500, 500],
      stops: [
        [0, "rgb(255, 255, 255)"],
        [1, "rgb(240, 240, 255)"]
      ]
    },
    borderWidth: 2,
    plotBackgroundColor: "rgba(255, 255, 255, .9)",
    plotShadow: true,
    plotBorderWidth: 1
  )
  f.lang(thousandsSep: ",")
  f.colors(["#90ed7d", "#f7a35c", "#8085e9", "#f15c80", "#e4d354"])
end
view with helper method
<%= high_chart_globals(@chart_globals) %>
<%= high_chart("some_id", @chart) %> #same id will replace origin char
combination
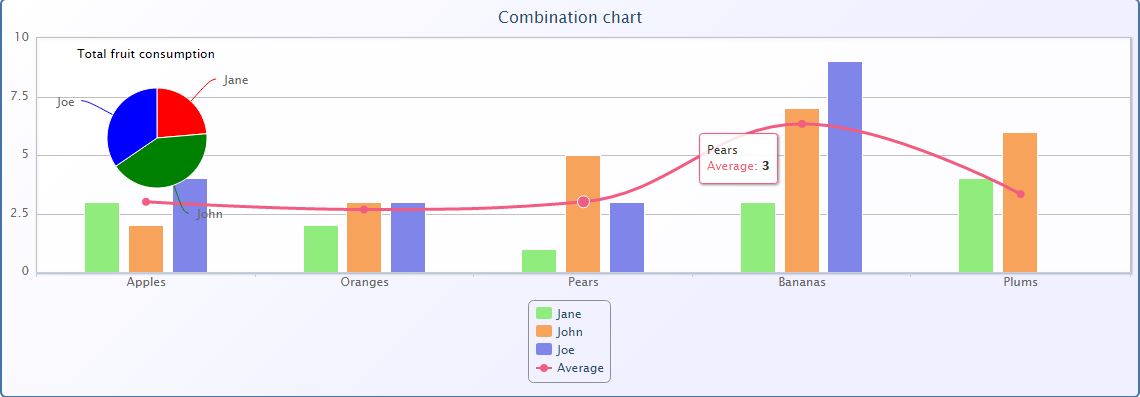
    @chart = LazyHighCharts::HighChart.new('graph') do |f|
      f.title({ :text=>"Combination chart"})
      f.options[:xAxis][:categories] = ['Apples', 'Oranges', 'Pears', 'Bananas', 'Plums']
      f.labels(:items=>[:html=>"Total fruit consumption", :style=>{:left=>"40px", :top=>"8px", :color=>"black"} ])
      f.series(:type=> 'column',:name=> 'Jane',:data=> [3, 2, 1, 3, 4])
      f.series(:type=> 'column',:name=> 'John',:data=> [2, 3, 5, 7, 6])
      f.series(:type=> 'column', :name=> 'Joe',:data=> [4, 3, 3, 9, 0])
      f.series(:type=> 'spline',:name=> 'Average', :data=> [3, 2.67, 3, 6.33, 3.33])
      f.series(:type=> 'pie',:name=> 'Total consumption',
        :data=> [
          {:name=> 'Jane', :y=> 13, :color=> 'red'},
          {:name=> 'John', :y=> 23,:color=> 'green'},
          {:name=> 'Joe', :y=> 19,:color=> 'blue'}
        ],
        :center=> [100, 80], :size=> 100, :showInLegend=> false)
    end
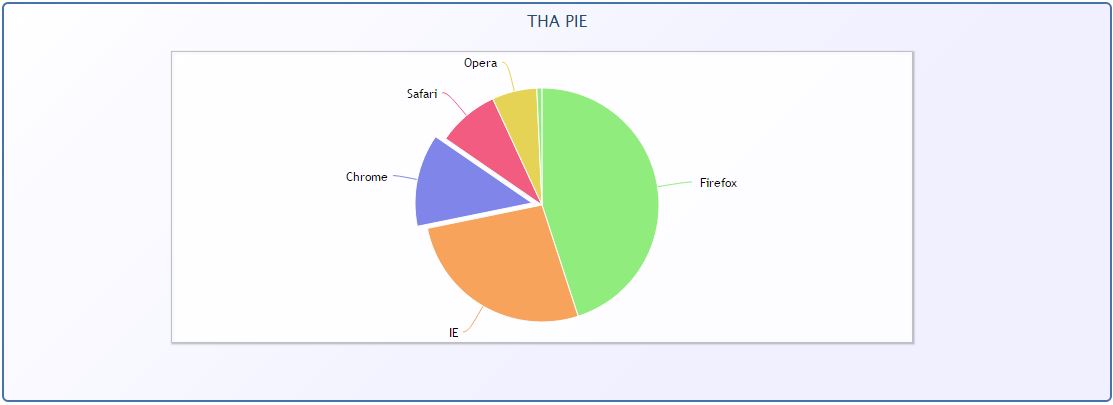
pie
@chart = LazyHighCharts::HighChart.new('pie') do |f|
      f.chart({:defaultSeriesType=>"pie" , :margin=> [50, 200, 60, 170]} )
      series = {
              :type=> 'pie',
              :name=> 'Browser share',
              :data=> [
                  ['Firefox',  45.0],
                  ['IE',      26.8],
                  {
                    :name=> 'Chrome',
                    :y=> 12.8,
                    :sliced=> true,
                    :selected=> true
                  },
                  ['Safari',    8.5],
                  ['Opera',    6.2],
                  ['Others',  0.7]
              ]
      }
      f.series(series)
      f.options[:title][:text] = "THA PIE"
      f.legend(:layout=> 'vertical',:style=> {:left=> 'auto', :bottom=> 'auto',:right=> '50px',:top=> '100px'})
      f.plot_options(:pie=>{
        :allowPointSelect=>true,
        :cursor=>"pointer" ,
        :dataLabels=>{
          :enabled=>true,
          :color=>"black",
          :style=>{
            :font=>"13px Trebuchet MS, Verdana, sans-serif"
          }
        }
      })
end
      <%= high_chart("my_id4", @chart) do |c| %>
          <%= raw "options.tooltip.formatter = function() {return '<b> YUPI!! '+ this.point.name +'</b>: '+ this.y +' %';}"  %>
          <%= raw "options.plotOptions.pie.dataLabels.formatter = function() { if (this.y > 5) return this.point.name; }"  %>
      <% end %>
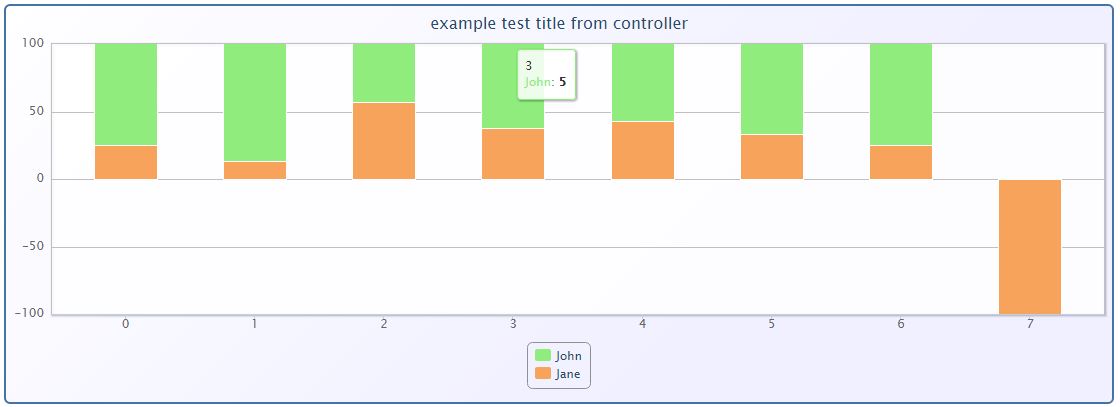
stack
   @bar = LazyHighCharts::HighChart.new('column') do |f|
      f.series(:name=>'John',:data=> [3, 20, 3, 5, 4, 10, 12 ])
      f.series(:name=>'Jane',:data=>[1, 3, 4, 3, 3, 5, 4,-46] )
      f.title({ :text=>"example test title from controller"})

      ###  Options for Bar
      ### f.options[:chart][:defaultSeriesType] = "bar"
      ### f.plot_options({:series=>{:stacking=>"normal"}})

      ## or options for column
      f.options[:chart][:defaultSeriesType] = "column"
      f.plot_options({:column=>{:stacking=>"percent"}})
    end